How can we more effectively use t-SNE to visualize high-dimensional data? And can we automatically find optimal t-SNE parameters for your data?
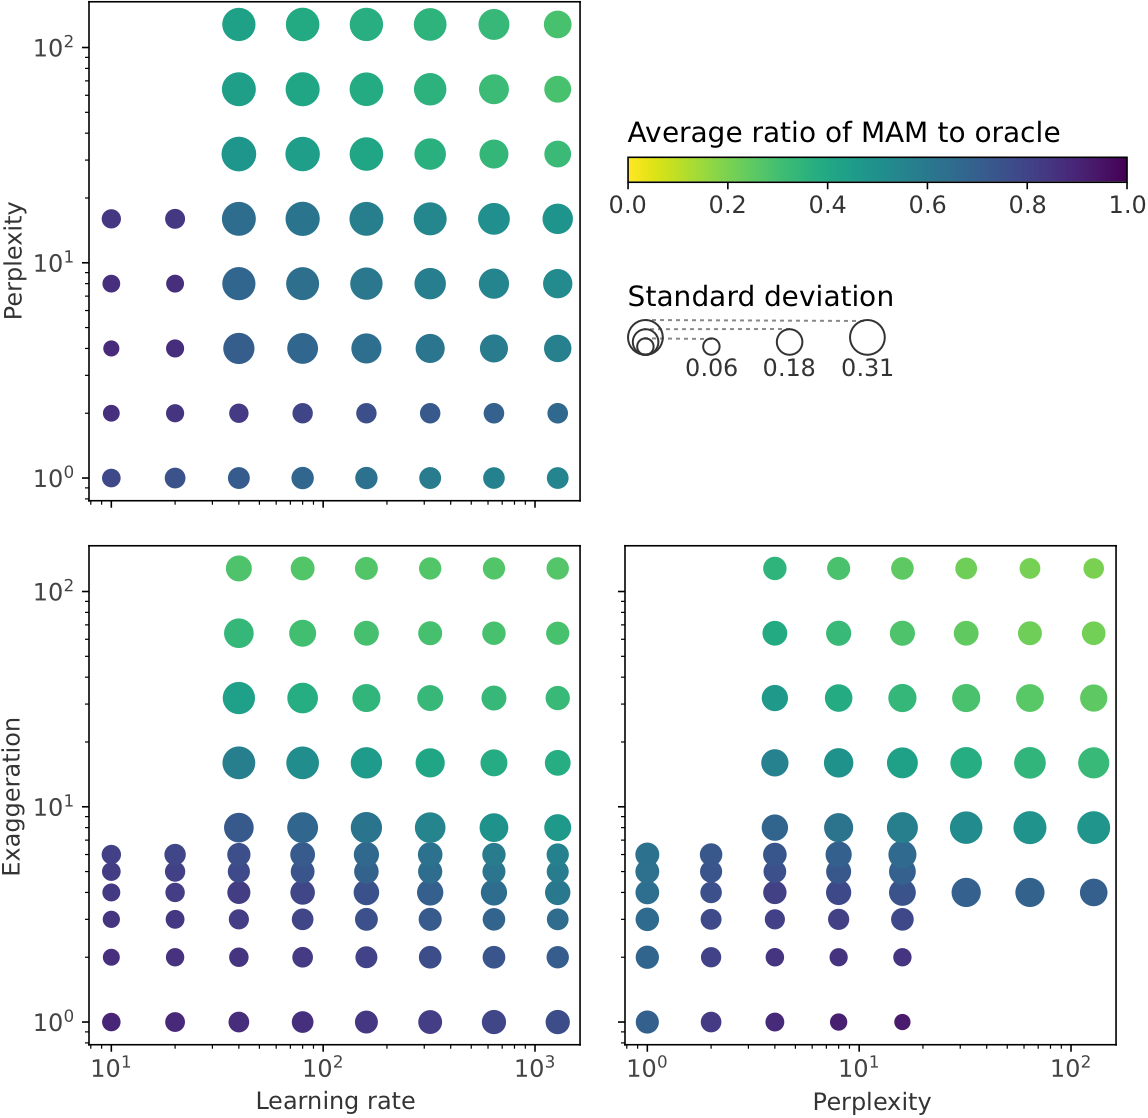
We revisit prior guidelines by conducting a study of t-SNE on 691 data sets, finding that many prior parameter range recommendations are unhelpful. From our study we recommend:
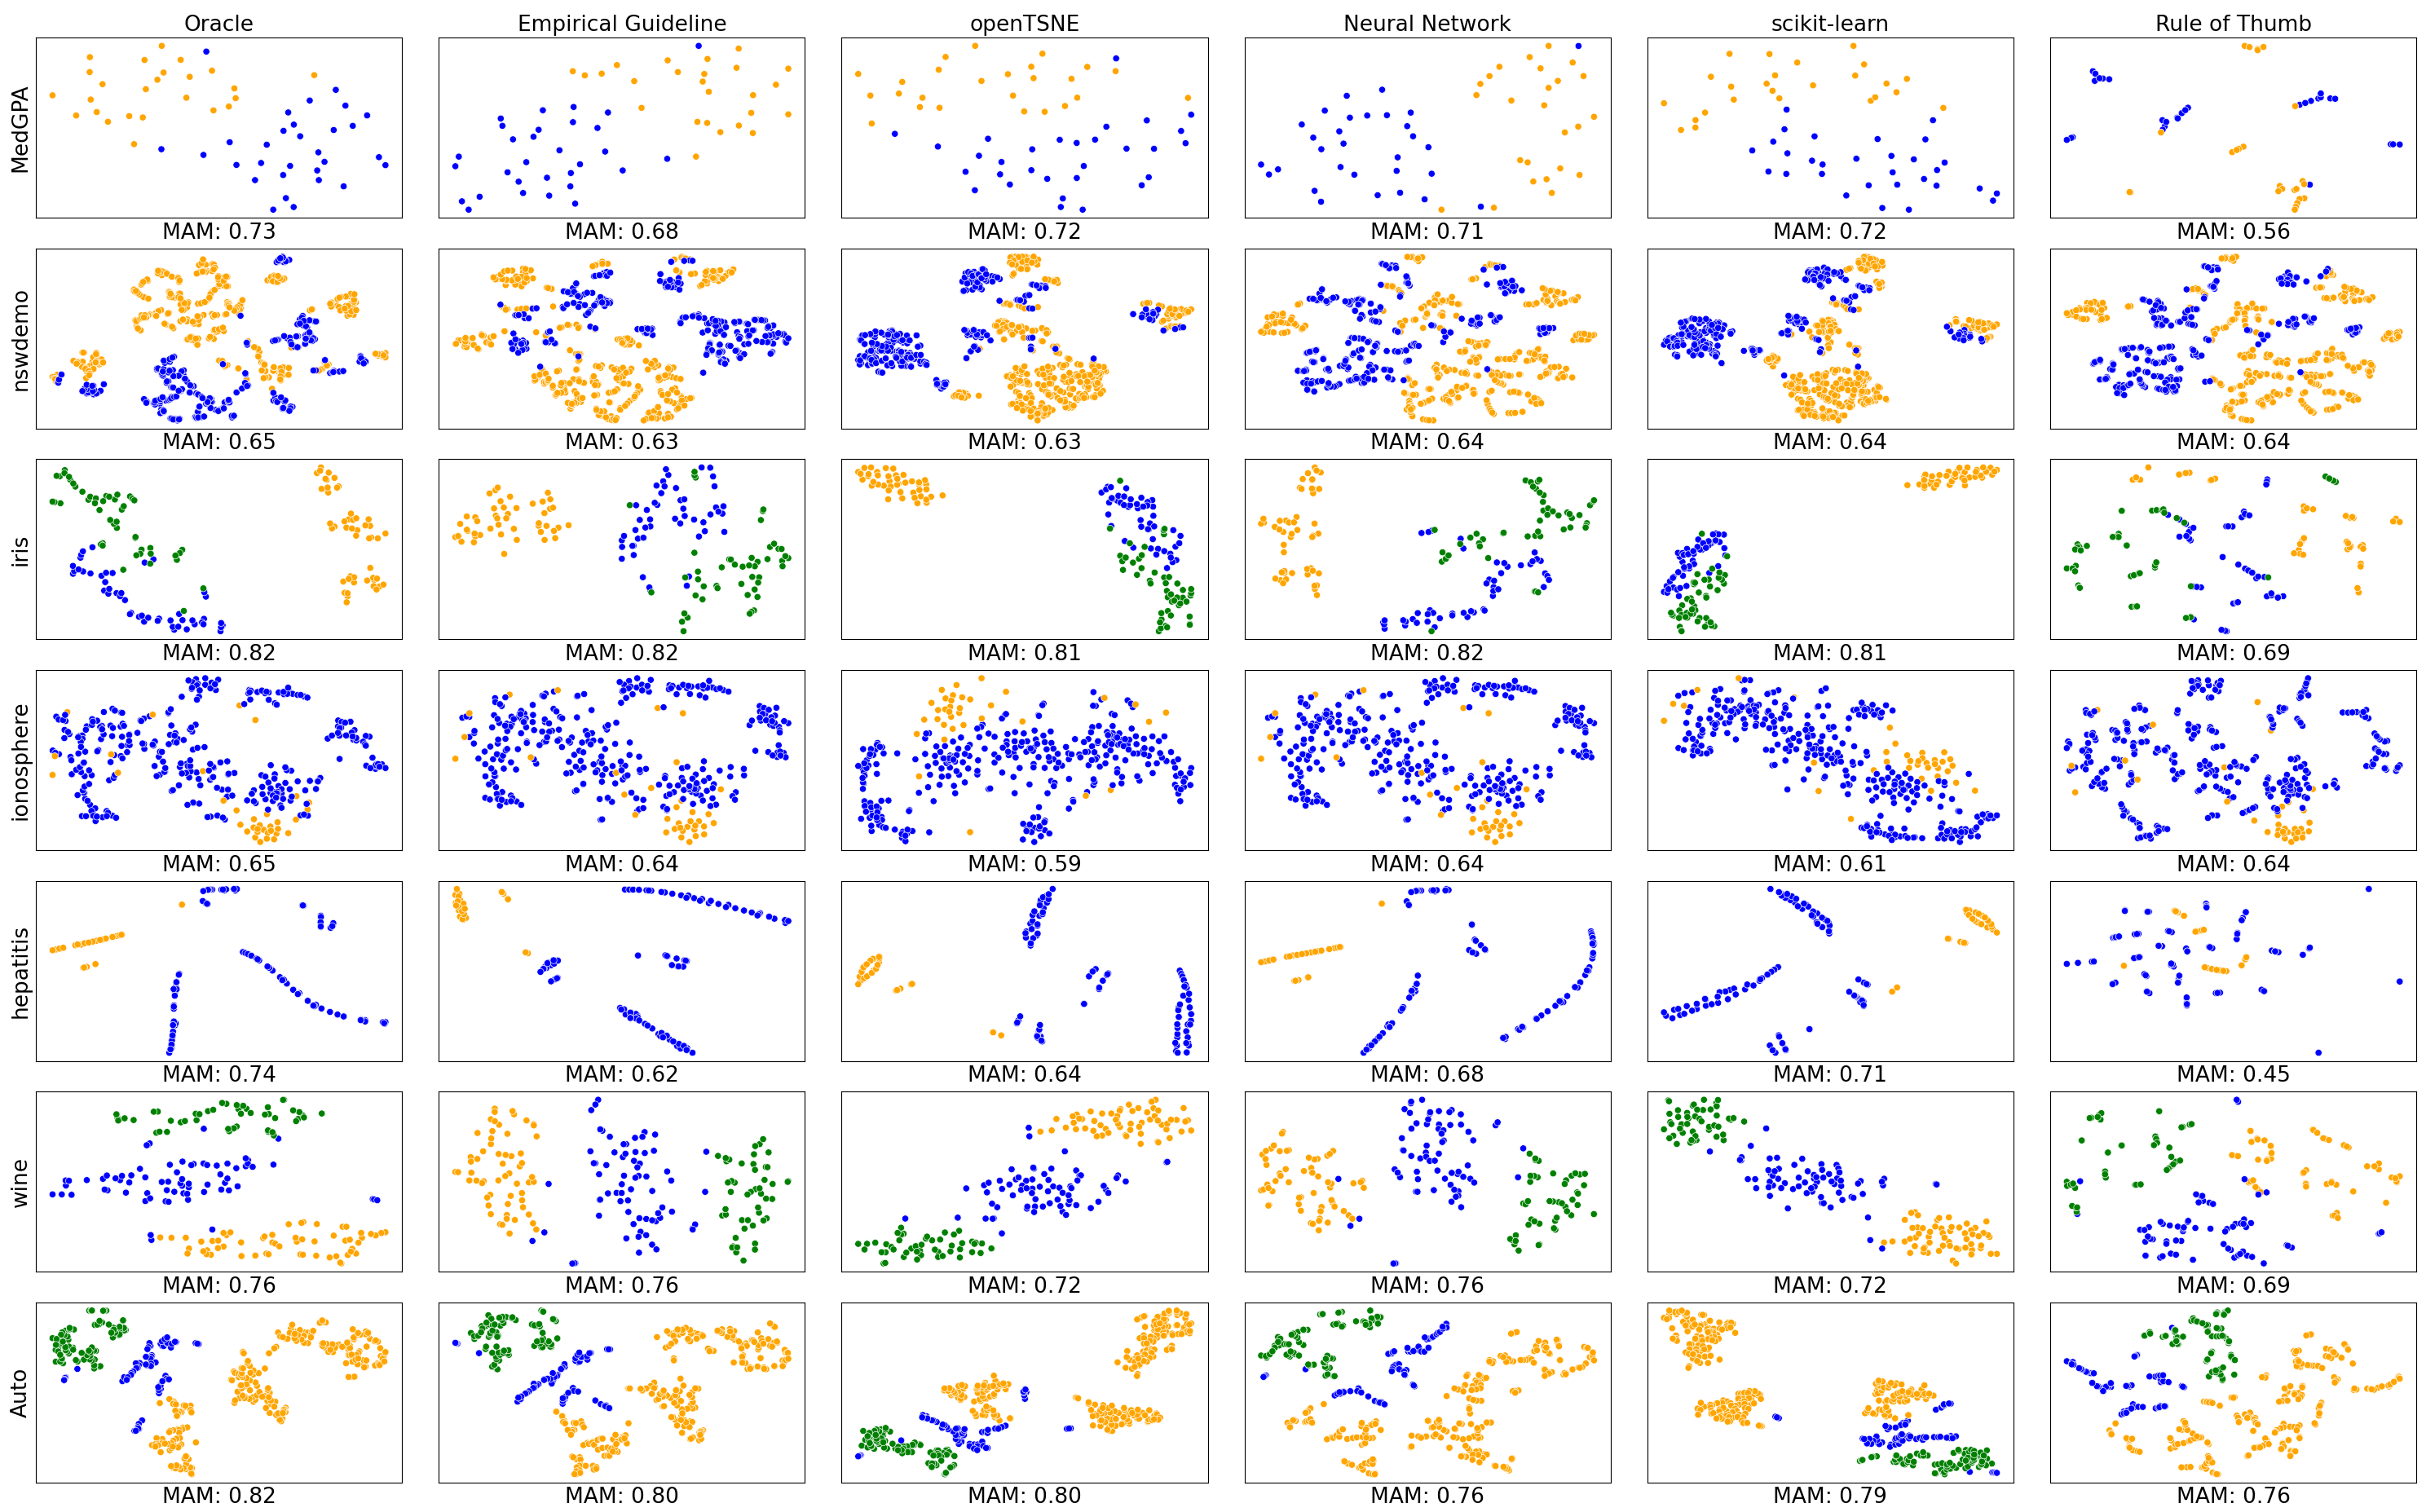
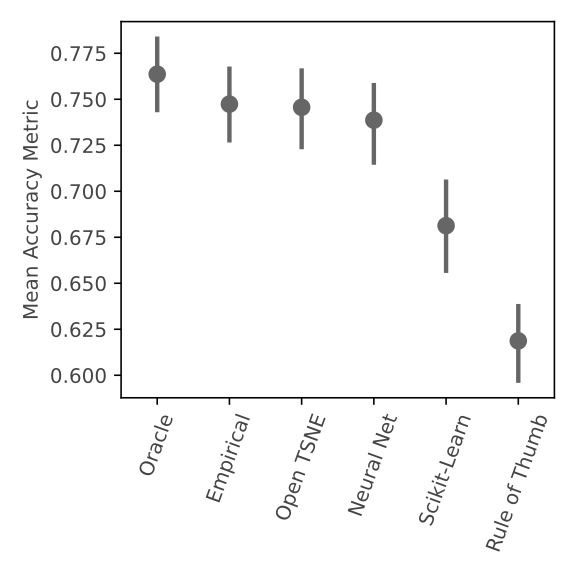
We also developed Auto t-SNE to automatically find good t-SNE parameters! It uses a neural network to predict t-SNE accuracy given a data set and parameter combo. Picking the best parameters takes about one second, way faster than a brute force approach! When evaluating Auto t-SNE we found it performed comparably to the OpenTSNE defaults, and dramatically better than the sklearn defaults.
We also replicated work by Belkina et al. (2019) and Kobak & Berens (2019):
Robert Gove, Lucas Cadalzo, Nicholas Leiby, Jedediah M. Singer, Alexander Zaitzeff. “New Guidance for Using t-SNE: Alternative Defaults, Hyperparameter Selection Automation, and Comparative Evaluation.” Journal of Visual Informatics (proc. Visualization Meets AI 2022). [pdf]