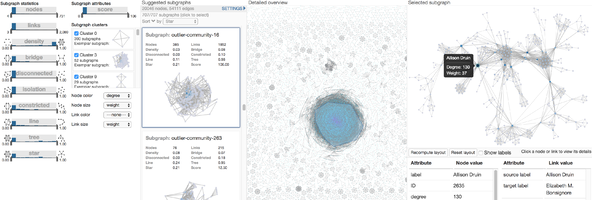


In this project I developed a rank-by-feature framework for interactively exploring large graphs. My goal was to interrogate the idea that large graph visualizations are useless hairballs, and test whether we can usefully explore large graphs by ranking, filtering, and interacting with subgraphs.
My system, called Chiron, centered on a rank-by-feature framework: Chiron divided the graph into user-defined and community-based subraphs, which users can sort and filter using intelligible features to find subgraphs matching their desired characteristics, and then users can select subgraphs to interact with them and see them in the context of the full graph. The full graph overview is in the middle of the UI. To the left, analysts use the subgraphs panel to sort and select subgraphs, and open the settings panel. In the settings panel, users can filter by 10 graph features, hide or show automatically identified clusters of similar subgraphs (using k-means clustering with k that optimizes the silhouette score), or change the properties used to size and color the vertices and edges. When users select a subgraph, Chiron highlights it in the overview and displays it on the right where users can interact, see tooltips, and select vertices and edges to see their properties.
I developed solutions to several challenges in this project:
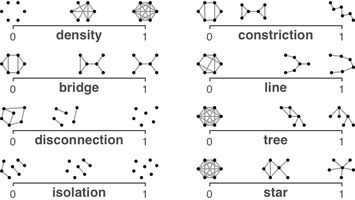
Robert Gove. “Gragnostics: Fast, Interpretable Features for Comparing Graphs.” Information Visualization 2019, best paper award. [pdf]