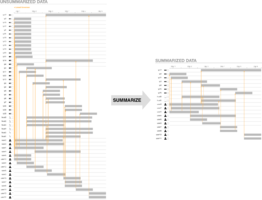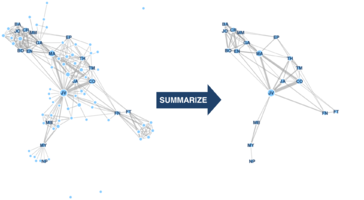


We have many ways to visualize network logs, social networks, and dynamic graphs in general, but we lack effective ways to provide overviews and summaries of complex timelines. This is troublesome for analysts who need to examine complex network logs and intrusion detection alerts to look for malicious activity. To address this, I converted network logs into dynamic graphs, and then I developed an algorithm to summarize the main sequence of events and most important elements in the graph. The summarization works analogously to the way you might summarize a book: give higher importance to components, narrative branches, and nodes based criteria such as duration of occurrence, occurrence frequency, number of relationships, importance of relationships, and number of nodes. Then filter out components, branches, and nodes whose average scores are below the threshold, which can be set by users or automatically from historical analysis. On intrusion detection alerts this substantially reduced their size and complexity while improving precision compared to ground truth. I also tested this on the Les Misérables character interaction graph and got results surprisingly close to human-generated summaries from SparkNotes and CliffsNotes.
I then collaborated with a data scientist to try to improve the summaries for network defense by optimizing the feature weights instead of naively averaging them. Training on red team events, we were able to not only improve the precision of intrusion detection alerts but also the F1 score. This surprising result is beneficial to network defenders because it has the potential to reduce the number of false positives they need to analyze without removing true positives.
How to Automatically Summarize Cyber Narratives
Nathan Danneman and Robert Gove. “Tuning Automatic Summarization for Incident Report Visualization.” PacificVis 2022. [pdf]
Robert Gove. “Automatic Narrative Summarization for Visualizing Cyber Security Logs and Incident Reports.” IEEE Transactions on Visualization and Computer Graphics 2022 (proc. VizSec 2021, best paper award). [pdf] [osf]
Robert Gove and Nathan Danneman. “Automatic Summarization and Visualization of Incident Reports.” Conference on Applied Machine Learning for Information Security 2020.