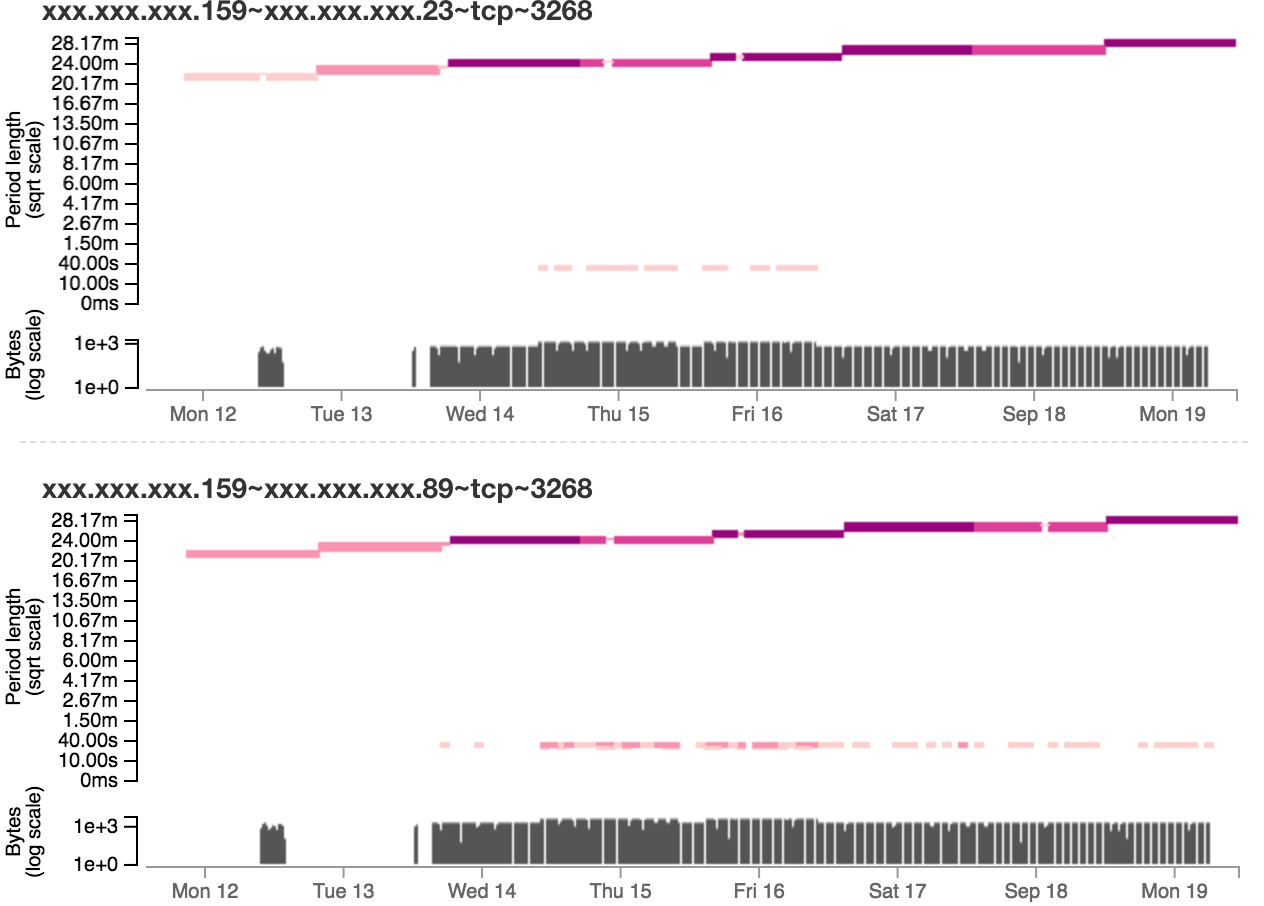
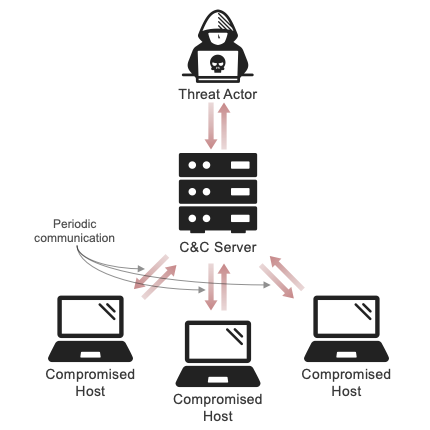
Indentifying network traffic from malware is important but challenging to differentiate from allowed network traffic. Malware tends to generate periodic network traffic to command and control servers, so one strategy is to look for periodic signals in network logs. I worked with a data scientist who applied Fourier transforms to this problem, and we collaborated on a visualization to show the results to cyber threat hunting teams. We developed a visualization that displayed turned the algorithm results into consummable visualizations, and interestingly we found that the Visual Information Seeking Mantra (overview first, then zoom and filter, then details on demand) was less useful than a sortable table to direct analysts to the most salient results.
Visualizing Automatically Detected Periodic Network Activity
Robert Gove and Lauren Deason. “Visualizing Automatically Detected Periodic Network Activity.” Visualization for Cyber Security 2018. [pdf]