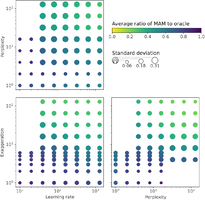
t-SNE Guidance and Automation
New guidance for using t-SNE, and a new method to automatically optimize visualizations.

New guidance for using t-SNE, and a new method to automatically optimize visualizations.
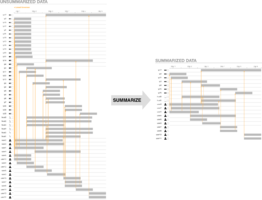
An algorithm for extracting key nodes, branches, and components from dynamic graphs.
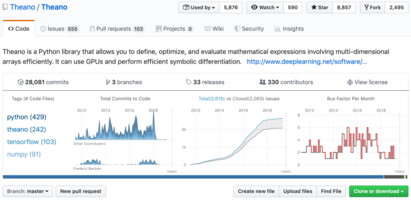
We designed and prototyped a GitHub dashboard to analyze repositories' maintenance history and technologies used.
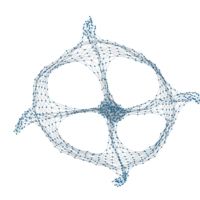
d3-force-sampled is a D3.js module that drastically speeds up graph layouts by using random sampling.
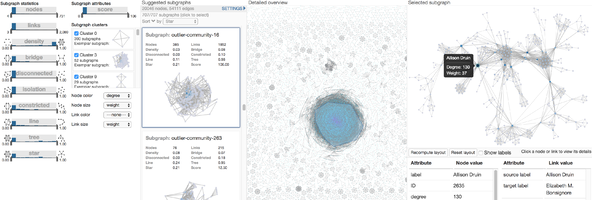
O(v + e) feature extraction and rank-by-feature framework for interactively exploring subgraphs in large graphs.
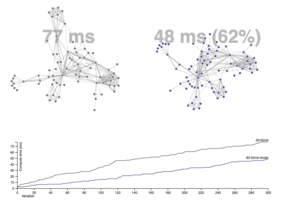
The d3-force-reuse D3.js module speeds up D3's graph layout algorithm by reusing Barnes-Hut approximations.
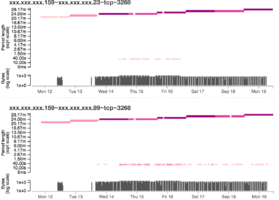
A threat hunting tool for identifying malicious network traffic via periodic signals.
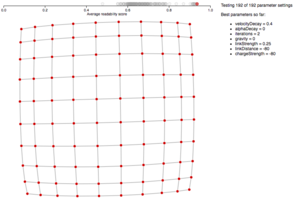
Greadability.js is a JavaScript library for calculating readability metrics on graph layouts.
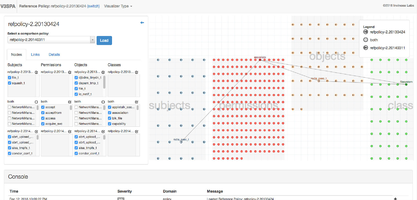
Using visual analytics to understand SELinux security policy structure and differences between policy versions.
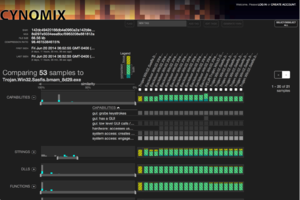
Interactive visualization for explaining malware clustering across multiple sets of attributes.
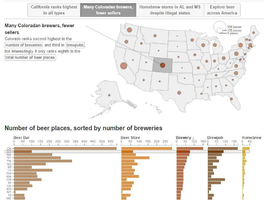
Interactive map exploring breweries, brewpubs, homebrew stores, beer bars, and beer stores in America.